

Web console
The web console is the live device view inside the BGeo dashboard at
bgeo.dev — a dev/debug tool for watching SDK devices in
realtime while you build and test, not a production fleet-management
product. It’s a purely server-side/dashboard feature, independent of which
client SDK a device runs: the same console works whether the linked device is
running the native Android, React Native or Flutter SDK, since all of them talk
to it the same way — by uploading through url/logUrl like any other
server. Treat what it stores as debug data: retention is limited (see
Retention below), not an archival record of every device
you’ve ever tested.
Getting access
Sign in at bgeo.dev — Firebase-backed auth, either Google or email/password.
Linking a device
Generate a registration code from the Registration codes page in the dashboard sidebar. Codes are valid for 7 days and good for up to 5 devices each; you can revoke one early if you don’t need it anymore.
There’s no dedicated “link device” screen built into the example app — exchange the code for device tokens yourself, then point the SDK’s uploader at the returned endpoints:
BackgroundGeolocation.ready( Config( url = "https://app.bgeo.dev/device/locations", logUrl = "https://app.bgeo.dev/device/logs", autoSync = true, batchSync = true, maxBatchSize = 50, authorization = AuthorizationConfig( strategy = "JWT", accessToken = accessToken, refreshToken = refreshToken, refreshUrl = "https://app.bgeo.dev/device/auth/refresh", refreshPayload = JSONObject().put("refresh_token", "{refreshToken}"), ), ),)From here the authorization (JWT refresh) machinery takes over natively — the console never needs your app process running to keep receiving data.
flowchart LR
    codes[Registration codes page] -->|generate| code[7-day code, up to 5 devices]
    code -->|entered/exchanged| register["POST /device/register"]
    register --> tokens[access + refresh token]
    tokens --> config["setConfig(url, logUrl, authorization)"]
    config --> upload[Native uploader posts\nlocations + logs + geofences]
    upload --> console[Web console:\nlive map, log stream, history]
Using it
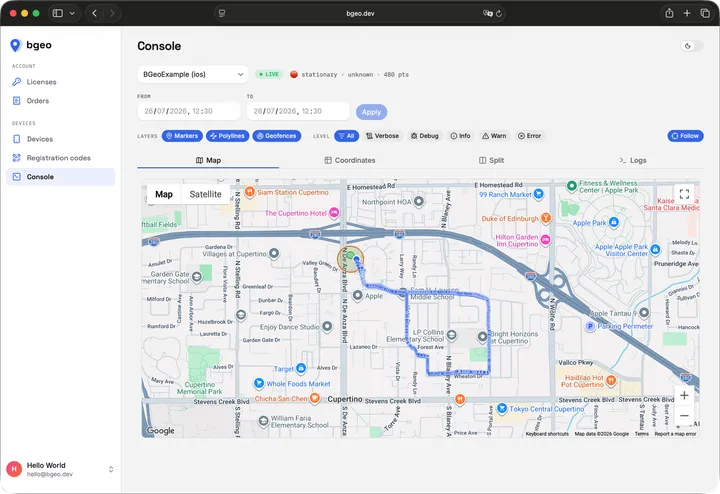
The console’s Console page ties a device selector, a From/To history range, and four tabbed views together — the current selection (device, tab, layers, range) lives in the URL, so a console view is shareable as a link:
- Map — the device’s route as a polyline, a live current-position marker (colored by moving/stationary), and its geofence set drawn as circles. Markers/polylines/geofences are independently toggleable layers.
- Coordinates / Split — the same points as a table, alone or side by side with the map.
- Logs — a virtualized log stream of structured entries matching the
SDK’s
LogEntryshape (timestamp, level, event, message, data), filterable by level. See the logging guide for what populates this stream and how upload cadence affects its latency.
A LIVE/OFFLINE indicator shows whether the console’s WebSocket push is connected; while connected, new locations, log lines, and geofence-set changes for the selected device appear without a page refresh. Applying a From/To range switches the map and log stream to server-side history for that window instead of the live buffer.
The Devices page lists every linked device with an online/offline badge (online = seen in the last 5 minutes), lets you jump into its console, or unlink it (which deletes its console data).
Retention
The console stores debug data with limited retention: locations and log events older than 14 days are purged automatically. Don’t rely on it as a permanent record — export or mirror anything you need to keep past that window from your own backend instead.
How data gets there
Once a device is linked, its SDK uploads locations and logs the same way it
would to any server you configured yourself: the native uploader batches and
posts to url for locations and
logUrl for logs, using the
authorization tokens set during linking. See the
data pipeline concept for how a fix
gets from the OS into that upload queue, and the
logging guide for the log
side of the same mechanism.
The Logs tab of the same console is shown on the logging guide.